842.7K views
The Real Cost of Turning It Down
842.7K56.5K319
View postPortfolio
Yung Geeski researches, designs, and animates data-driven finance videos — for brands' own accounts, and for sponsors who want to reach this audience.
Featured Posts
Instagram · Post 1 of 8
Congressional trading controversy measured against the most recognizable benchmark in investing. The moving-line format made viewers watch to the finish — and the fairness debate drove the comments.
Sponsored Campaign
The campaign generated approximately 292 direct “OPTION” responses — measurable audience intent, not passive viewership.
Instagram-only metrics, aggregated across 6 sponsored Reels.
Read the full case studyClient Case Study

An ongoing content partnership with Investing & Retirement, producing animated financial visualizations that make complex investing concepts accessible to everyday audiences. Across 46 Instagram posts, the content has generated over 5.5 million views, 294,000 interactions, and 142,000 shares. Approximately 93% of views came from non-followers, demonstrating the content's ability to reach new audiences.
Instagram metrics on the Investing & Retirement account, across 46 posts.
Which zodiac sign beats the market? I split every S&P 500 trading day since 1928 into its zodiac season, then tracked the cumulative return earned only during each sign.
Does the moon affect stocks? I split every S&P 500 trading day since 1928 into one of the eight moon phases, then tracked the cumulative return earned only during each phase.
Want content like this for your brand?
“The best in the biz!”
Michael Hewitt
Founder, Investing & Retirement
Audience
Share of Instagram followers, from Instagram analytics · Oct 2026
Services & Deliverables
I create research-driven, animated data visualizations that turn complex financial information into engaging, easily understood social media content. From initial research and data preparation to chart design and final animation, I handle the production process from start to finish.
I research, design, and animate branded charts that you publish on your own channels.
Like the ongoing Investing & Retirement partnership.
Your brand is integrated into a chart published natively to the Yung Geeski audience, clearly disclosed.
Like the Delta Options campaign.
Researching financial topics, sourcing reliable datasets, cleaning data, and identifying interesting stories.
Designing animated charts that communicate financial trends, comparisons, and historical performance.
Producing content optimized for Instagram Reels, TikTok, YouTube Shorts, and other social platforms.
Incorporating brands, products, or services into financial content through custom integrations.
Producing recurring, branded visualizations for financial educators, investment companies, and media organizations.
Deliverables can include finished high-resolution videos, custom branding, captions, source references, and platform-specific exports, depending on the agreement.
Reposts
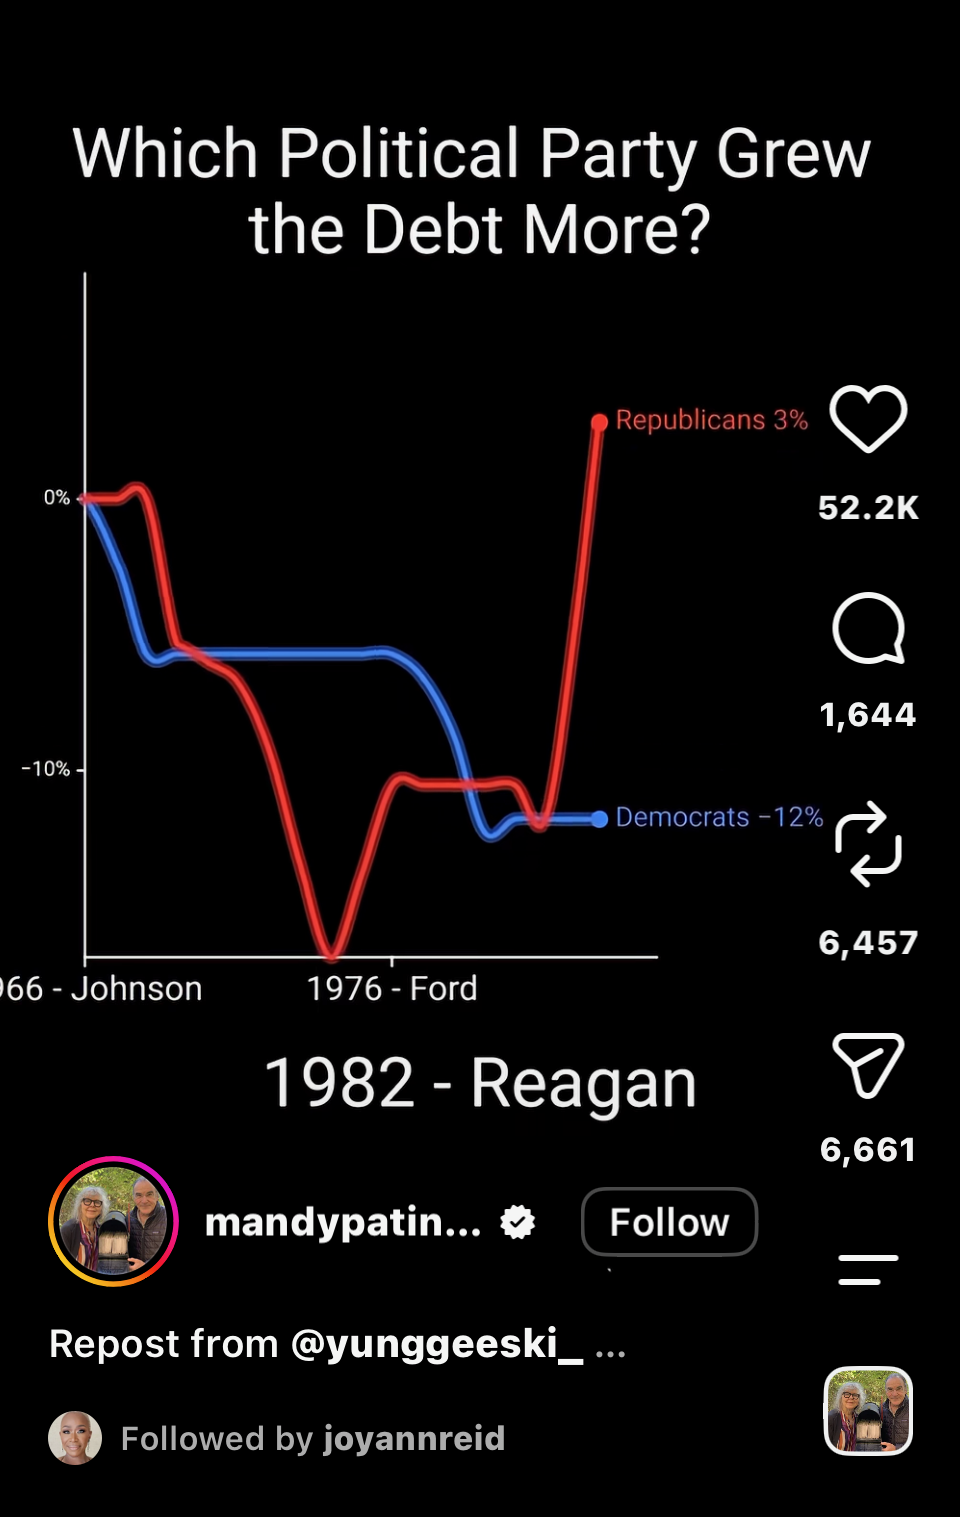
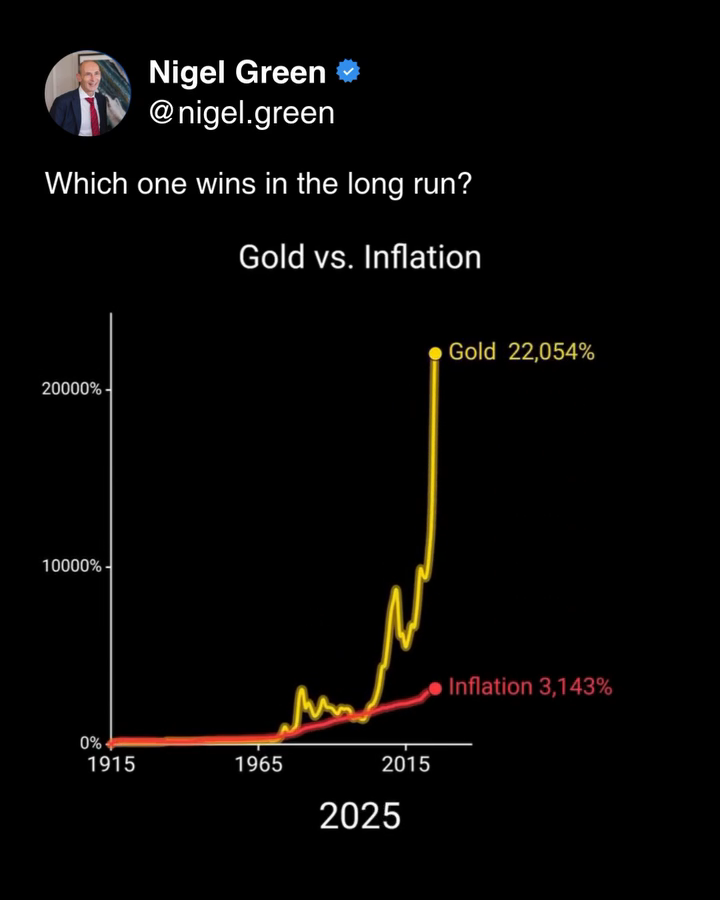
Charts picked up and shared organically by public figures with national and international reach.
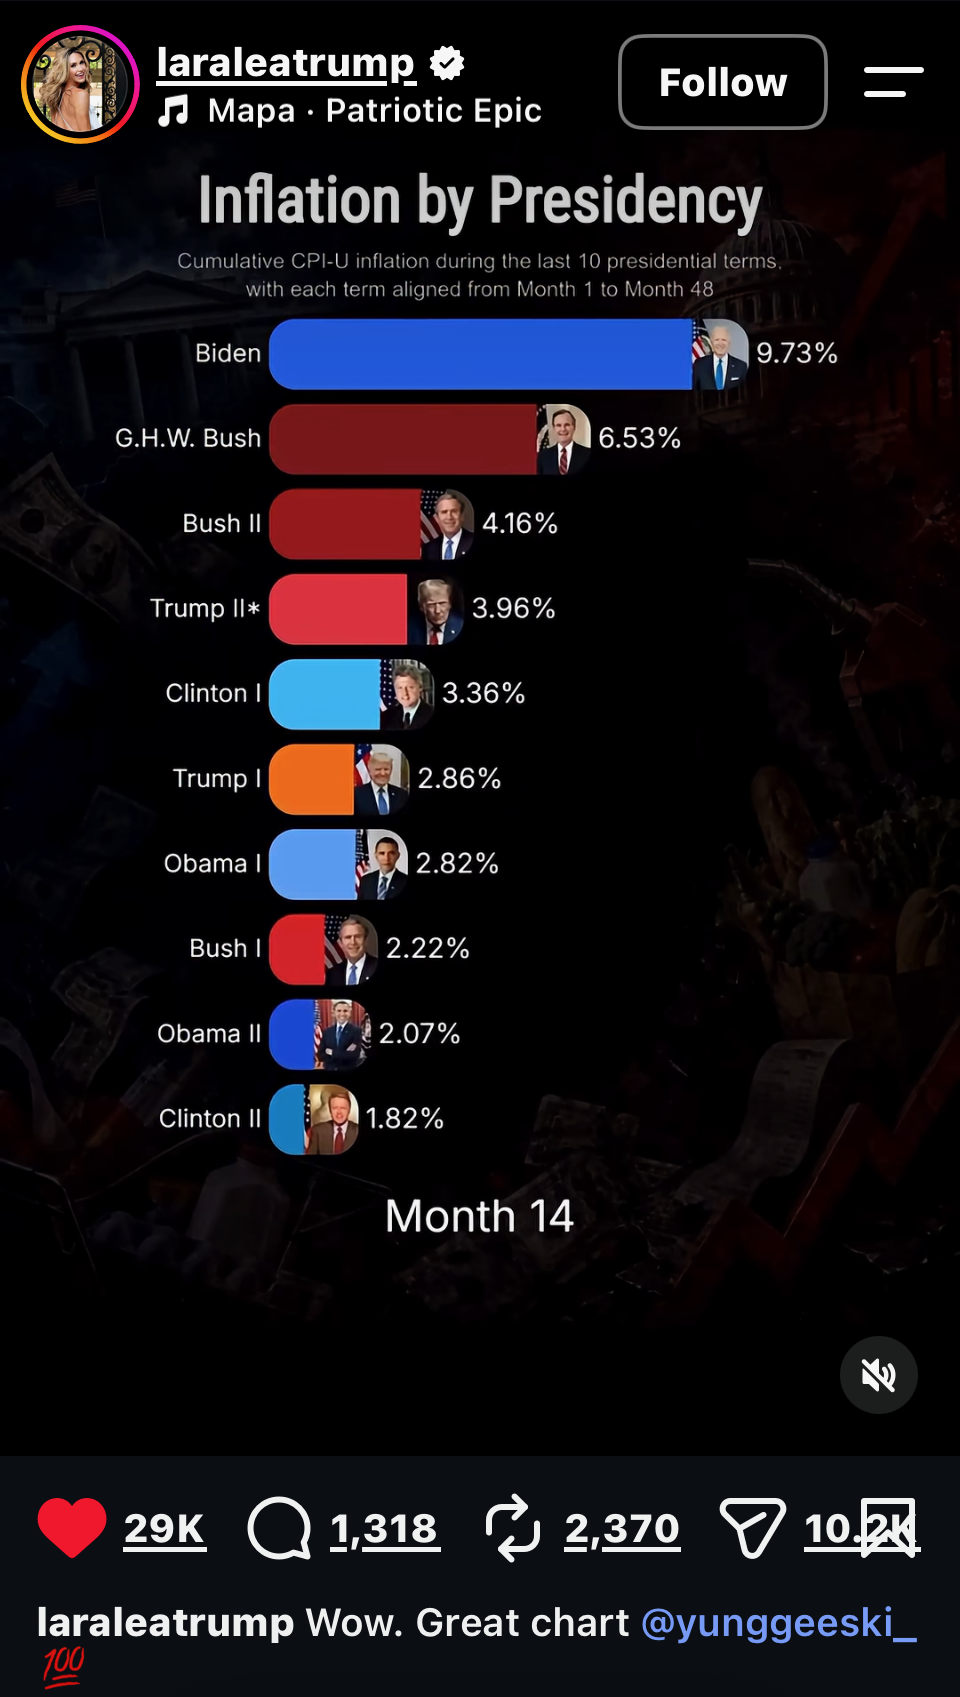 EnlargeInstagram
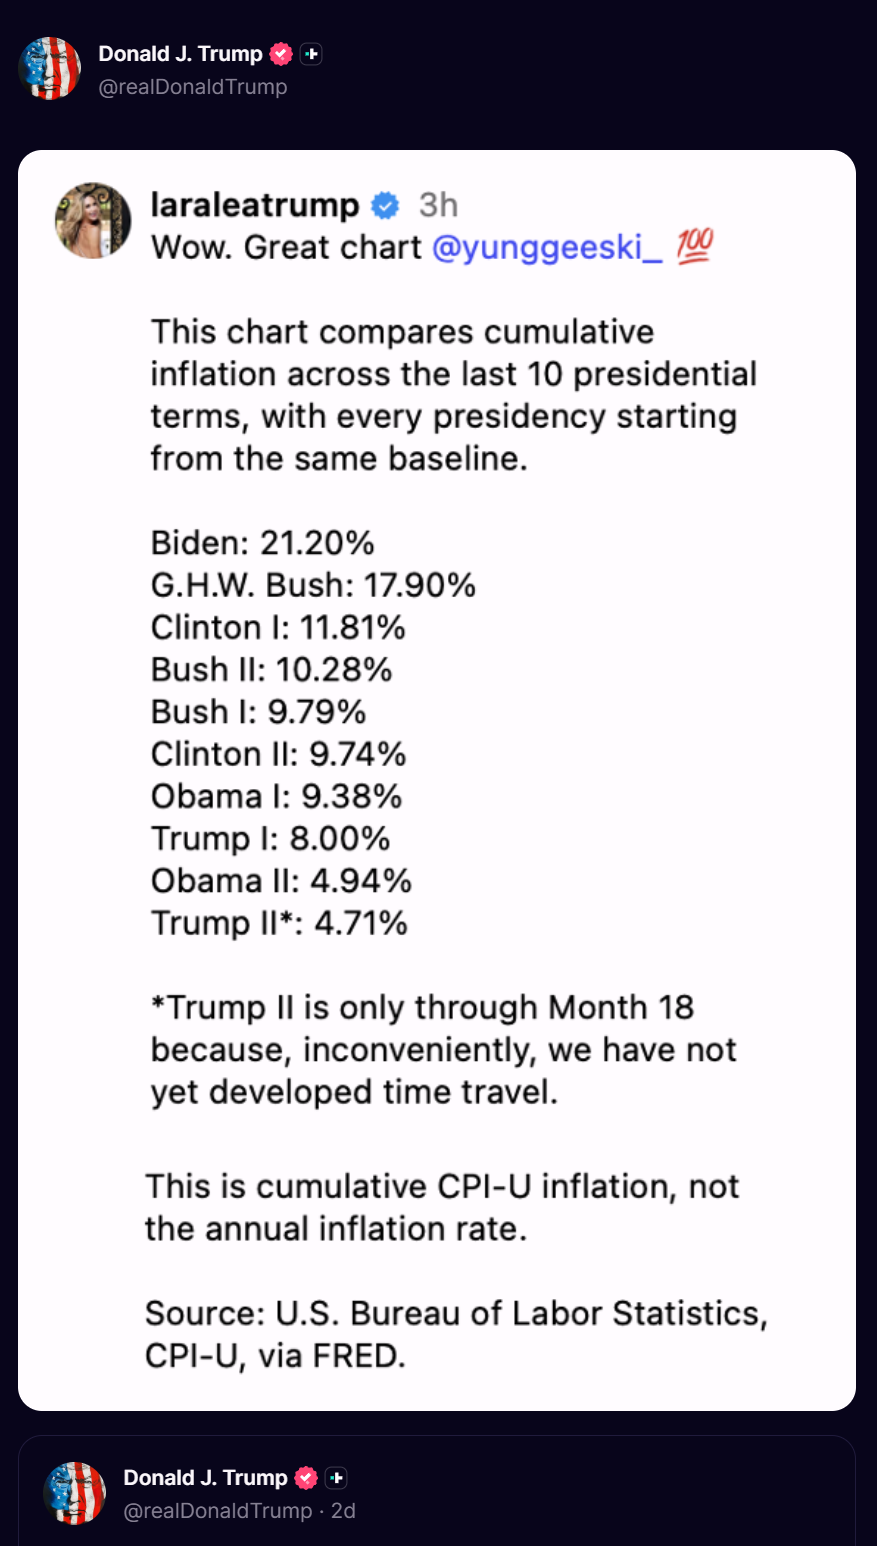 EnlargeTruth Social
 EnlargeInstagram
 EnlargeFacebook
Public posts by the accounts shown, linked so you can verify each one. Sharing a chart does not imply endorsement of, or any business relationship with, Yung Geeski.
Press
Publications that have covered Yung Geeski charts.4 original reports · 2 syndicated reprints
Get in Touch
Have an idea, a product, or just a question? Email me directly or send a short note below — no campaign brief needed.
Prefer your own inbox? Write to me directly and I'll reply from there.
Email Meyunggeeski1@gmail.com
Four quick fields. You'll get a confirmation right away.